Dev Console (Dashboard Engine)
The dashboard is its own gem. activeagent is the framework — agents, providers, generation, telemetry reporting — and actionagent is a mountable Rails engine that adds the dashboard on top of it: every agent generation recorded as a trace with a span waterfall, a metrics overview, and the agent builder, interactions and evaluations alongside them — running inside your app against your own database while you build. The hosted activeagents.ai platform mounts the same engine, so what you see locally in development is what the platform shows (plus the accounts, plans, billing and managed sandbox infrastructure a hosted product has to have) once you point telemetry at it. Every platform workspace starts with a free low-volume trial.
![Dashboard: traces list with expandable span timelines]
Quick start
The dashboard's models are Active Record models and its runs persist conversations, so actionagent adds activerecord and solid_agent on top of what the framework already pulls in — neither of which activeagent itself requires. Add both gems:
# Gemfile
gem "activeagent"
gem "actionagent"bundle install
rails generate action_agent:install
rails db:migrateThe generator:
- copies three migrations —
active_agent_telemetry_traces(the trace store),active_agent_dashboard_tables(agents, runs, versions, conversations, evaluations, sandboxes, recordings, keys) andactive_agent_evaluation_scenarios(scenario suites and their per-model results; re-run the generator on an existing install to get it); pass--traces_onlyfor a trace sink alone, - mounts the engine at
/activeagents, - writes
config/initializers/action_agent.rb.
API keys and provider credentials are encrypted at rest, so run rails db:encryption:init before creating any (or set ActionAgent.encrypt_credentials = false to store them in plain text — a deliberate downgrade, not a default).
Deploying this beyond your laptop — for a team, or as the trace sink for a fleet of apps? See Self-Hosted Observability.
Then enable telemetry with local storage in config/active_agent.yml:
telemetry:
  enabled: true
  local_storage: true
That's it. Run any agent and open /activeagents — each generation appears as a trace with prompt/LLM/tool spans, timing, token usage (input / output / thinking), provider and model. The dashboard's React bundle ships prebuilt in the actionagent gem, so mounting it doesn't ask your app to run a JavaScript build.
local_storage: true writes traces through the engine's trace model, so it only works in the app that mounts the engine. Without actionagent installed, telemetry logs that it has nowhere to write — apps that only run agents point telemetry at an endpoint: instead (see below).
What you get
| Page | Path | Contents |
|---|---|---|
| Ask ActiveAgents | /activeagents/assistant | Ask about recorded evaluations and prepare an agent draft for review (development and test only — see below) |
| Agents | /activeagents | Your agents with per-agent request, token and error stats; build, edit, version them, and test them as a user in the Run Agent workbench (see below) |
| Traces | /activeagents/traces | Every generation: agent + action, status, duration, tokens; expandable span timeline; All/Errors filter; 30s auto-refresh |
| Metrics | /activeagents/metrics | The service overview: golden signals, six time series over 1h/24h/7d, and the top agents, models, actions, tools and error types (see below) |
| Interactions | /activeagents/interactions | The conversations behind the traces: messages, tool calls, generations |
| Evaluations | /activeagents/evaluations | Scored agent outputs, and scenario suites replayed across models (see below) |
| Console | /activeagents/console/traces | The same traces and metrics server-rendered, without JavaScript; span waterfall per trace at /activeagents/console/traces/:id |
| Ingest API | POST /activeagents/api/traces | JSON trace ingestion from other apps and SDKs (local_storage writes through the model instead, no HTTP) |
Testing an agent as a user
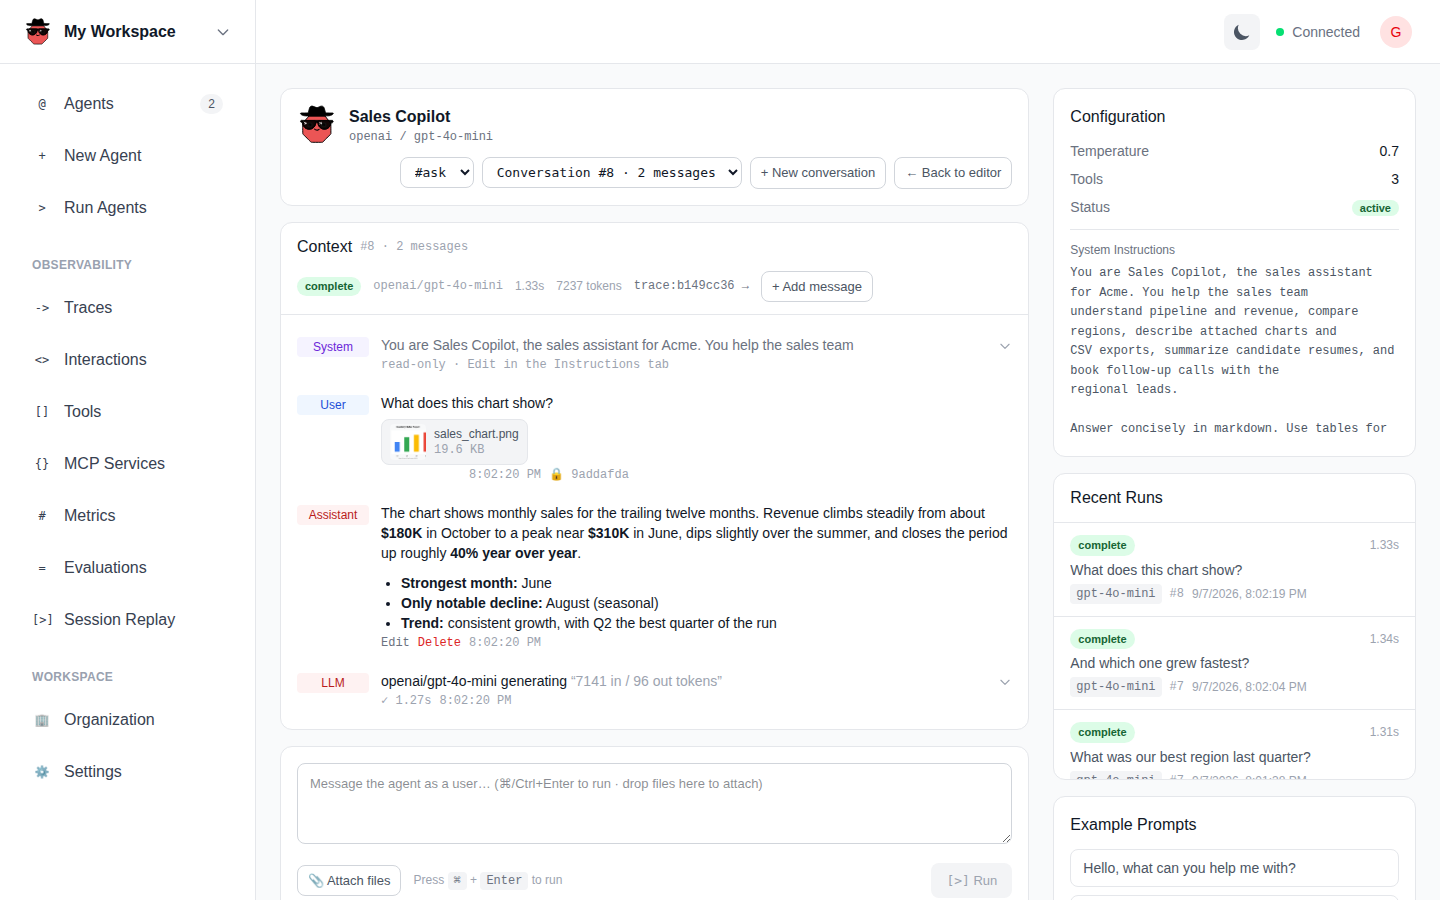
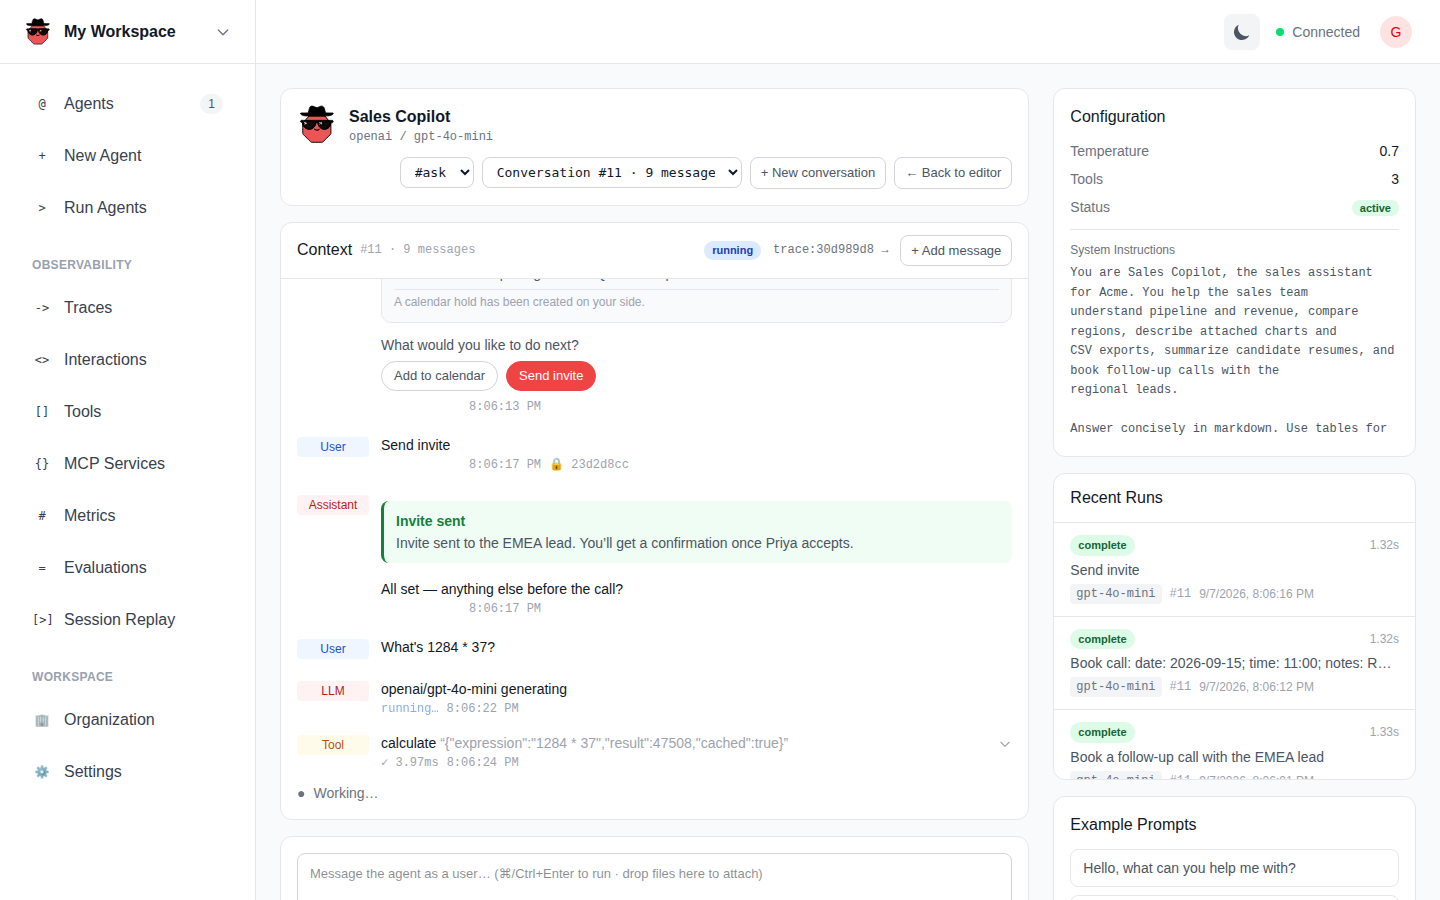
Every agent page has a Run Agent button. It opens a workbench that works the agent the way a user would — a conversation, not a one-shot prompt box — so you can watch what the model is given, change it, and run again.
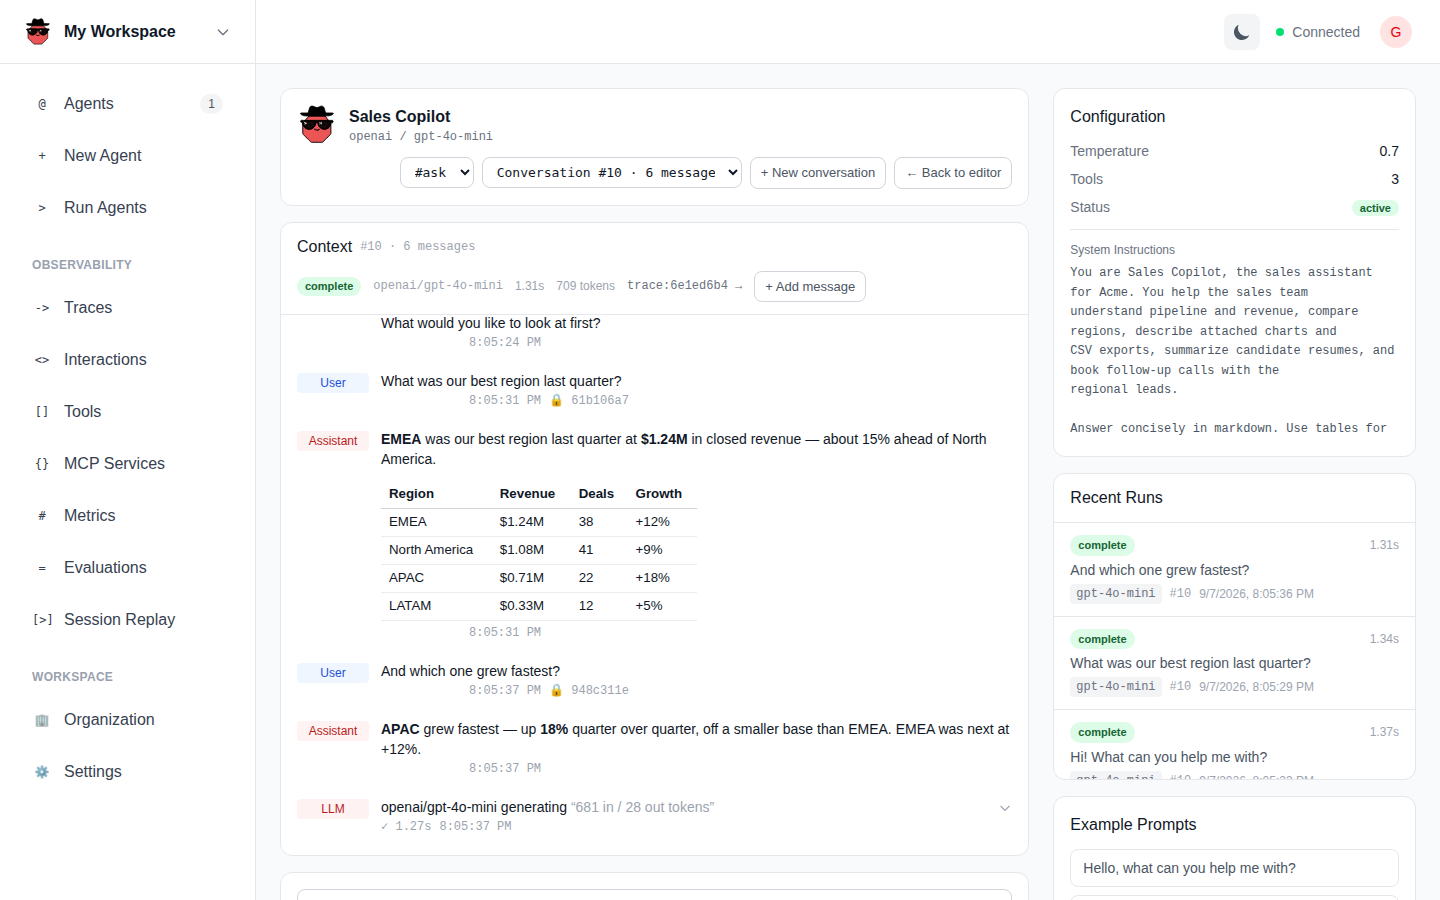
Add user messages. Type a message and press Run (or ⌘/Ctrl+Enter). The run executes under the agent's instructions and the selected action, and the reply streams into the conversation with the same LLM/tool activity feed the Interactions view shows. The conversation is pinned: the next message is sent with every user and assistant turn before it, so "and which one grew fastest?" means what it would mean to a person. Each run is still its own AgentRun with its own trace, which is how Traces and Interactions keep showing exactly what the model saw.
The workbench follows the dashboard theme:
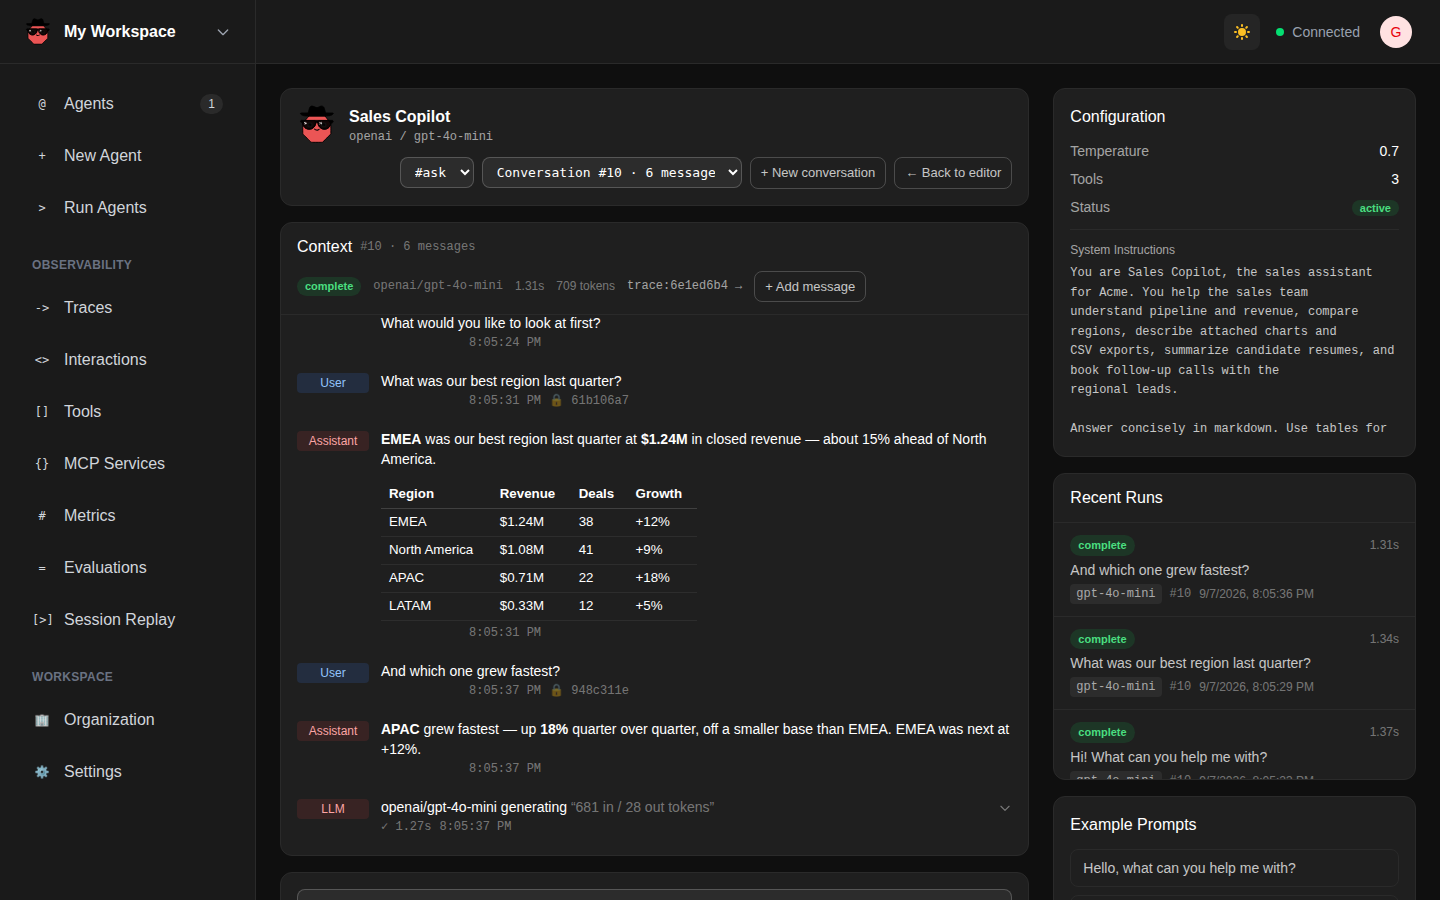
Modify the context. The conversation on the page is the persisted solid_agent context, and it is editable: hover a turn to edit or delete it, use Add message to seed a user or assistant turn without running anything, and New conversation to start from an empty context. The system row shows the composed instructions the run executes under (edit those on the Instructions tab). Editing a previous question and asking a follow-up is the quickest way to see how an agent handles a changed history.
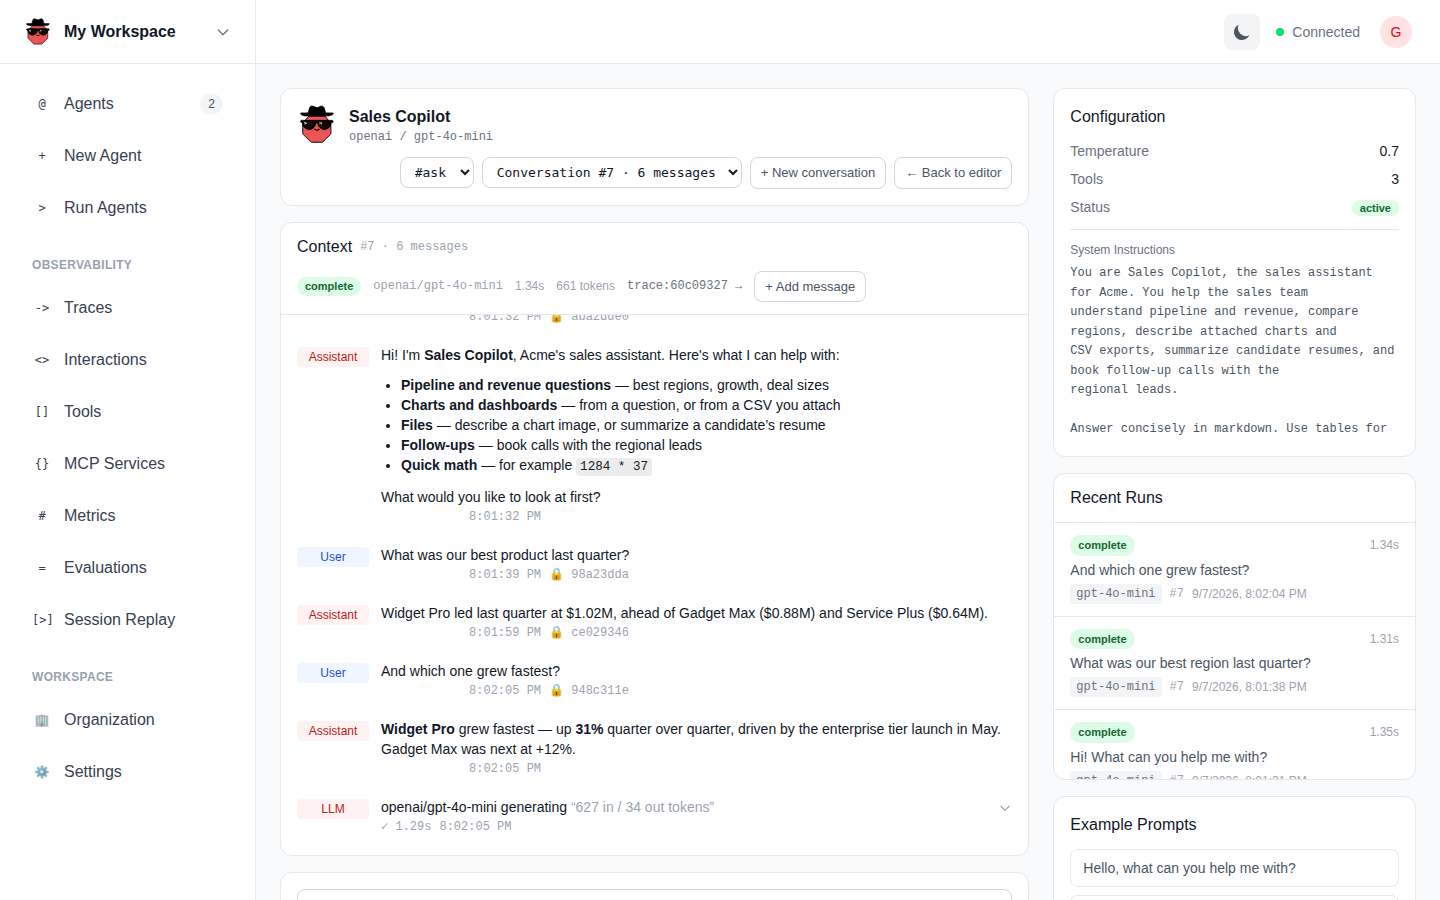
Attach files. Files attached to a message upload with the run through Active Storage (AgentRun has_many_attached :attachments), and reach the model according to their kind: images as vision input, PDFs as documents, and text-like files — CSV, Markdown, JSON, plain text — inlined into the message, with the filename and size in a header the model can cite. The persisted user message keeps an attachment manifest, so the conversation shows the thumbnails afterwards. A host app without Active Storage keeps everything else and answers attachment uploads with a clear 422.
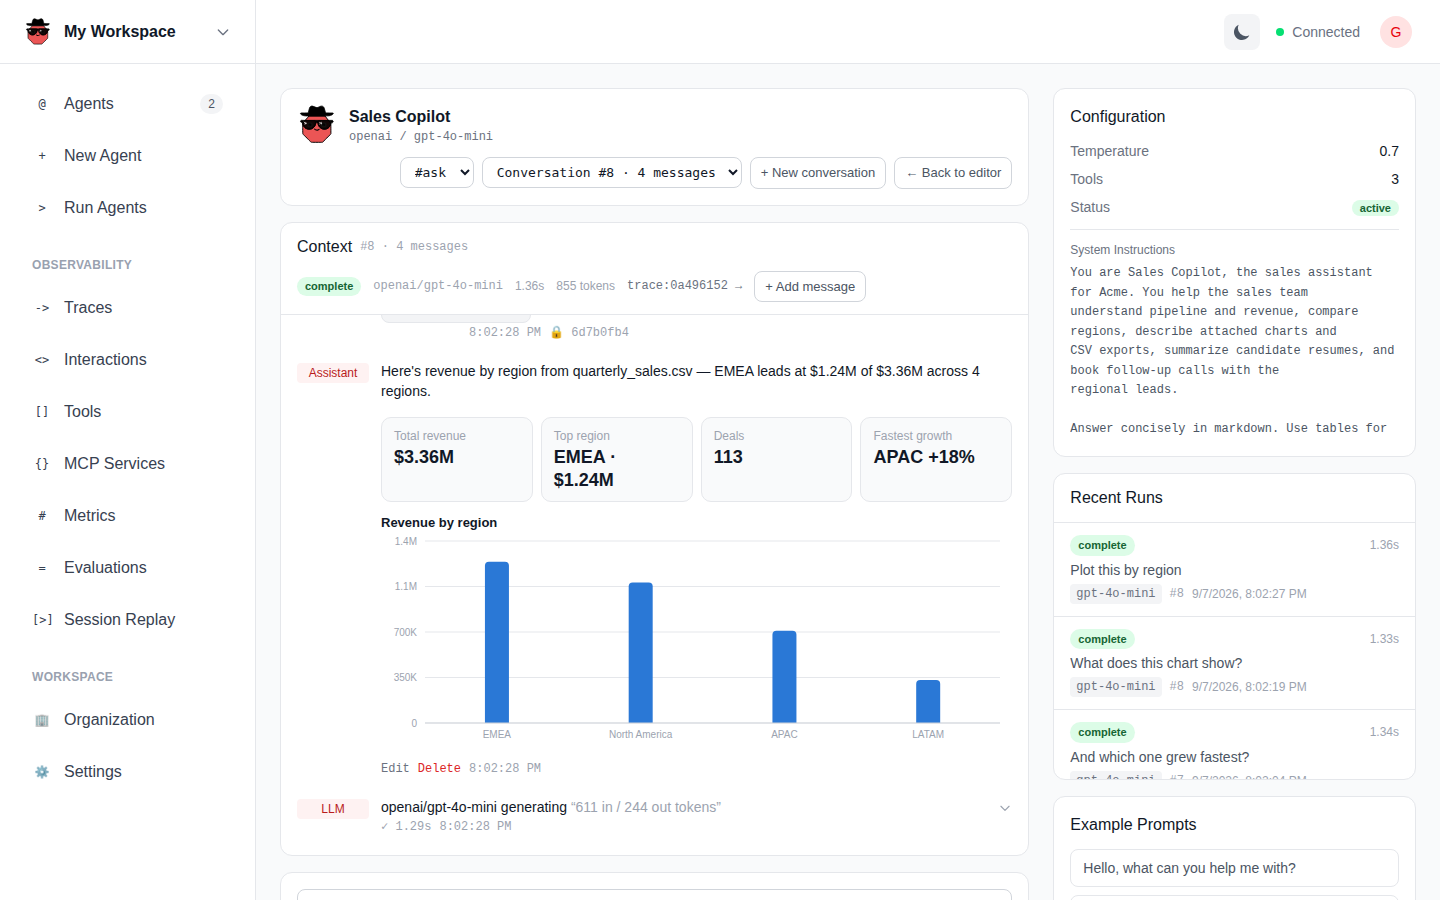
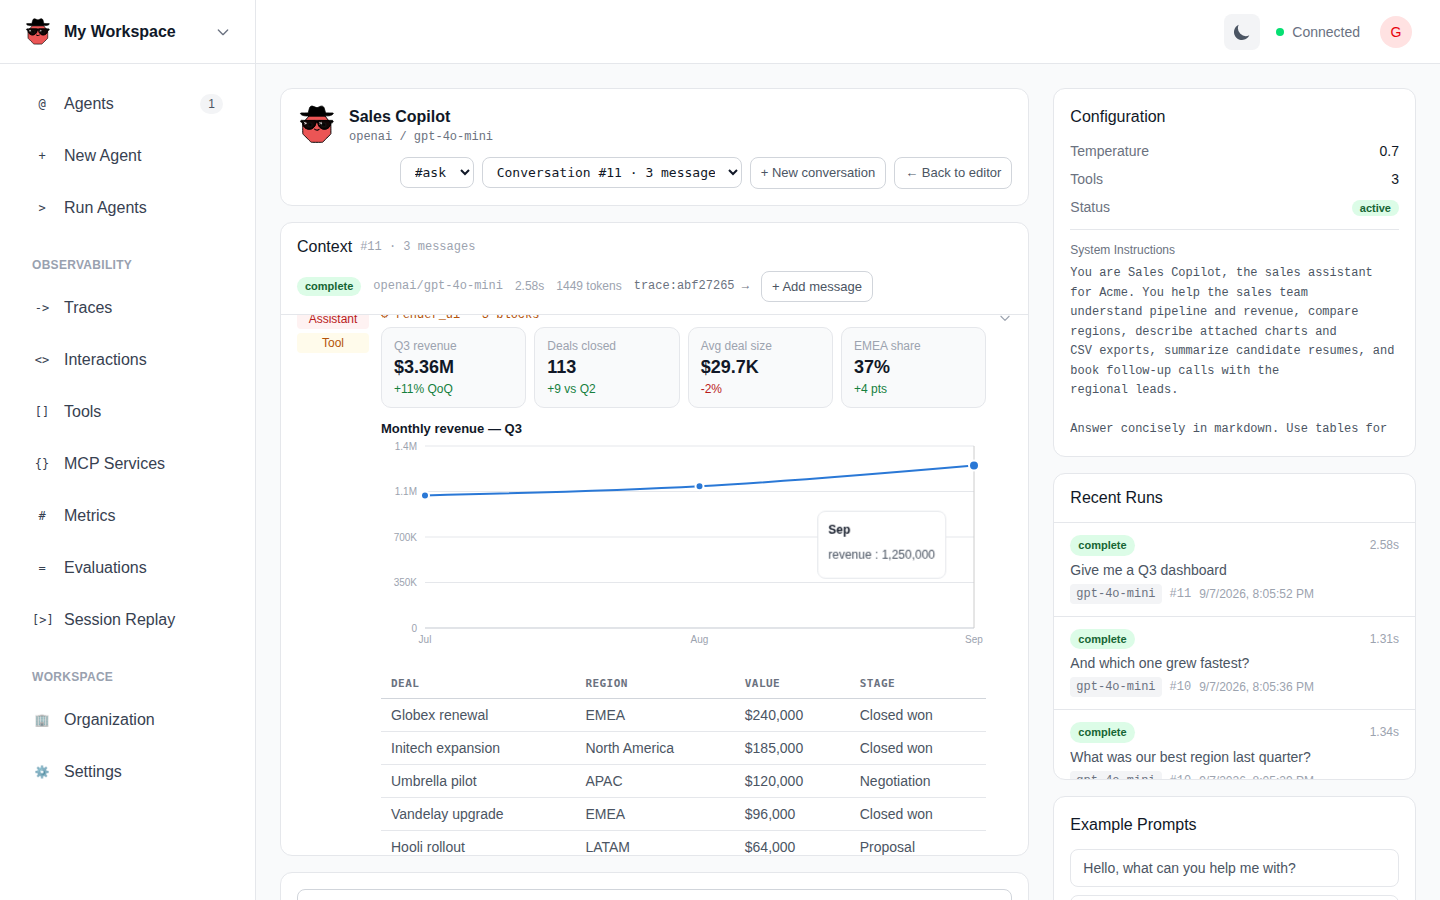
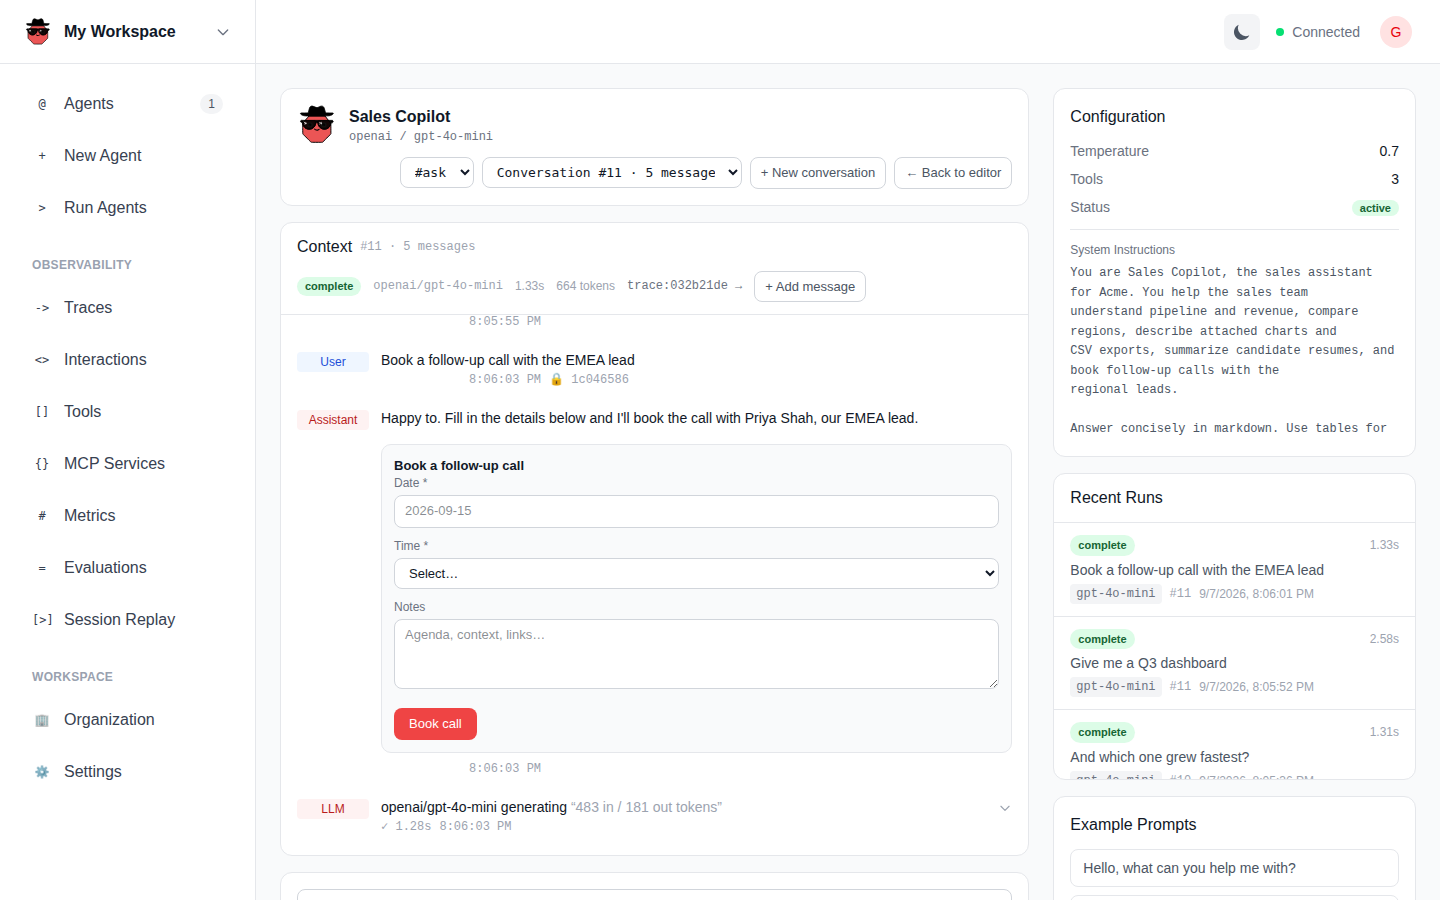
Generative UI. An assistant reply can carry UI instead of, or alongside, prose: cards, stats, tables, charts, lists, progress bars, forms, choice buttons, images, callouts and code. Three ways in, all rendered by the same component:
- a fenced
```uiblock in a markdown reply whose body is JSON — an array of blocks, or{ "blocks": [...] }; - a JSON reply whose top level is
{ "ui": [...] }(aresponse_formatagent, say) — any other JSON object renders as a key/value block; - the Generative UI tool (
render_ui) — enable it on the agent's Tools tab and the model can call it with{ "blocks": [...] }.
Forms and choices are live: submitting a form or clicking a choice posts the answer back into the conversation as the next user message, so a model can ask for input and continue.
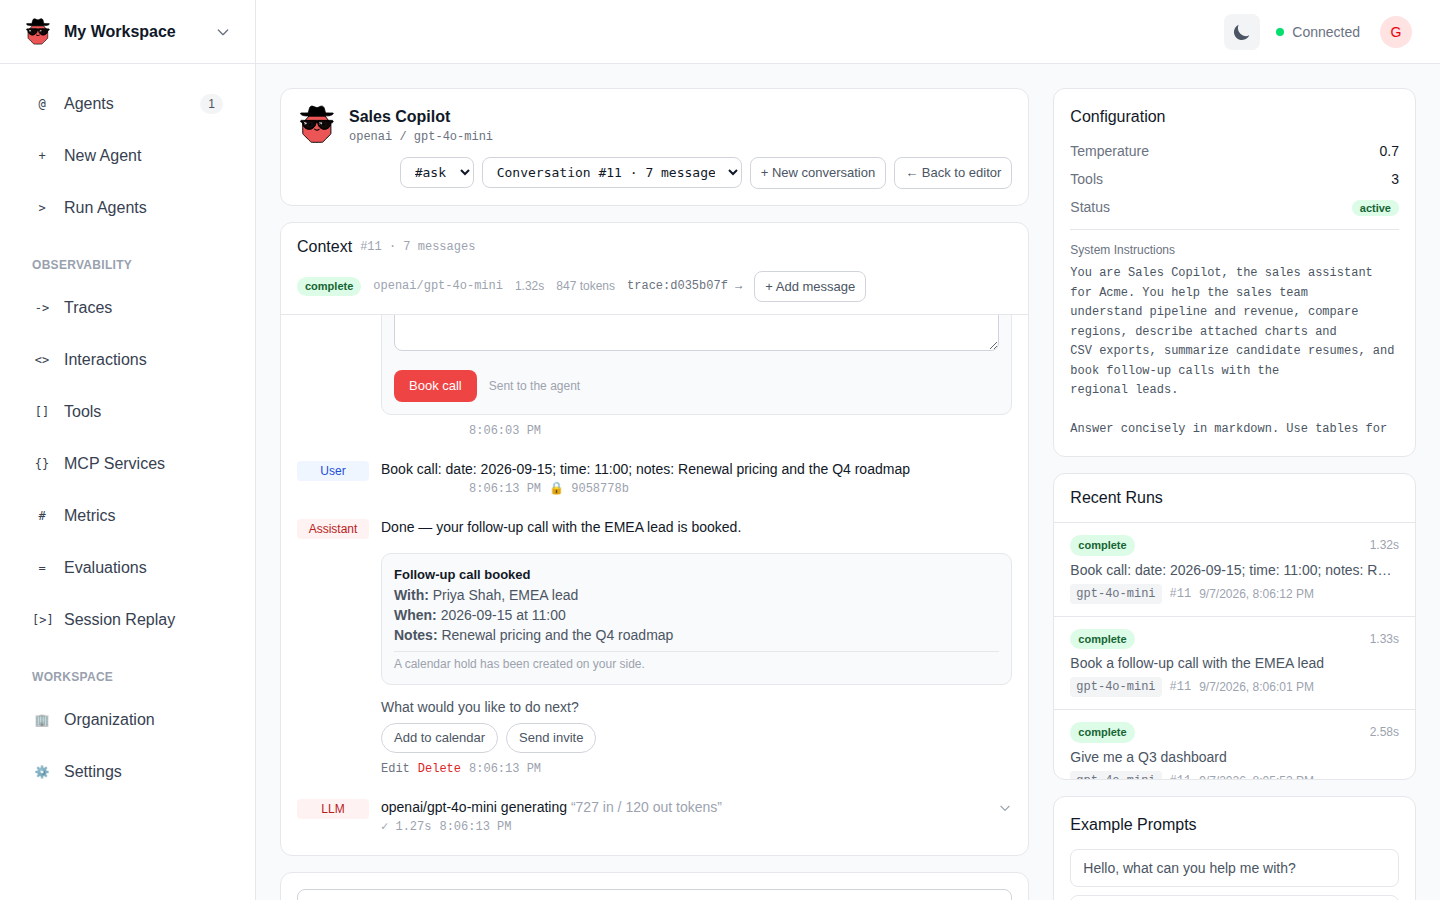
While a run executes, the LLM and tool calls stream into the conversation as they happen — here a calculate call answered mid-run:
[
  { "type": "stats", "items": [
    { "label": "Revenue", "value": "$3.36M", "delta": "+11%", "tone": "positive" },
    { "label": "Deals", "value": "113" }
  ]},
  { "type": "chart", "chart": "bar", "title": "Revenue by region",
    "x": "region", "series": ["revenue"],
    "data": [ { "region": "EMEA", "revenue": 1240000 }, { "region": "APAC", "revenue": 710000 } ] },
  { "type": "form", "title": "Book a follow-up", "submit": "Book call",
    "fields": [
      { "name": "date", "label": "Date", "type": "text", "required": true },
      { "name": "time", "label": "Time", "type": "select", "options": ["09:00", "11:00", "15:00"] }
    ]}
]
Block fields: card {title, body, image_url, footer}, stat {label, value, delta, tone}, stats {items}, table {columns, rows}, chart {chart: bar|line|area|pie, title, x, series, data}, list {title, items, ordered}, progress {label, value}, form {title, submit, fields[{name, label, type: text|textarea|number|select|checkbox, options, placeholder, required}]}, choices {prompt, options}, image {url, alt, caption}, callout {tone, title, body}, code {language, code}.
Blocks are rendered as React elements only, never as HTML. An image (or a card's image_url) is displayed straight away when it is a data:image/… URL or one of your own app's — an Active Storage blob, say. A URL on any other host is shown as a button naming that host instead: fetching an image is a request to whoever serves it, and the model chose the address, so the person reading the reply decides whether to make it.
Time-series charts on the console's metrics page use the optional groupdate gem when present and degrade gracefully without it; the React metrics page reads buckets the API already aggregated and needs nothing extra.
Ask ActiveAgents
A tool for developing and CI-ing agents, not a production surface. Answering a question means sending recorded prompts, outputs and evaluation report excerpts to a model provider, so the page and its API are available in development and test only. Where it is off there is no nav item, no route and no endpoint — both /activeagents/api/dashboard_assistant actions answer 403. Turn it on somewhere else deliberately, or off everywhere:
# config/initializers/action_agent.rb
ActionAgent.configure do |config|
  config.assistant_enabled = true   # or false to remove it in development too
end
Choose a provider and model, then allow that provider to process your message, recent conversation history and authorized report excerpts. Configure a provider credential in Settings first. The assistant uses the host's authentication, agent scope, execution policy and quota hooks.
Ask which demo questions passed, why an evaluation failed, or describe an agent to build. Report cards link to recorded evidence and disclose weak checks and missing provenance. Historical passes cannot establish that current main works. Compact report references remain available when earlier excerpts are replaced. Raw recorded exceptions are withheld from assistant evidence because they may contain credentials; open the authorized report to inspect those details. Agent drafts open in the builder for review; they are not saved or run by chat.
Conversation state resets on reload. Assistant generations disable framework traces and provider notifications, and message/history parameters are filtered before Rails request logging. Provider retention and any host middleware that records raw HTTP bodies still follow the host's policies. Repository connections, COI execution, Claude Code sessions and PR checks remain planned work.
Metrics
/activeagents/metrics answers the question an on-call tab is open for: is this service healthy right now, and if not, since when. It is laid out the way an APM overview is — golden signals across the top, one grid of time series under them, top-N lists down the right — because the point is to see a change and then find what moved, not to read a table.
Pick a window with the 1h / 24h / 7d control. The window fixes the bucket size the whole page is drawn at — 60 buckets of a minute, 96 of 15 minutes, 84 of two hours — so the charts stay the same shape whatever the traffic, and the indicator beside the control says which (live · 15 min buckets, refreshed every 60 seconds).
Five golden signals lead: Requests (with requests per minute), Latency (p50, with p95 and p99 under it), Error rate (with the error count and how many were rate-limited), Tokens (input and output) and Cost (with cost per request). Each carries a 24-point sparkline of its own series and a delta against the period of the same length just before the window — more traffic and falling latency read as success, a rising error rate as error, volume and spend stay neutral, because a bigger number is not by itself good or bad.
Six panels plot the window:
| Panel | What it shows |
|---|---|
| Requests | Bars per bucket, stacked by agent, with deploy markers |
| Latency | p50 / p95 / p99 lines, with the incident marker |
| Errors | Bars stacked by error class, with the incident marker |
| Tokens | Input and output lines |
| Cost | Estimated spend per bucket |
| Tool calls | Calls per bucket, errored calls stacked on top |
The right rail ranks what is behind them: Agents by requests (with p95, error rate and cost), Models by tokens, Slowest actions by p95, Tools by calls (with average duration and error rate) and Errors by type — 429 rate limit, timeout, tool error, provider 5xx, other, always all five so the shape of a spike is readable at a glance.
Filter to one agent from the select, or by clicking its row in the Agents rail; clicking it again clears the filter. Everything narrows together — signals, charts and rails — so the page never shows a filtered chart next to an unfiltered tile. The rail keeps listing every agent while a filter is on, with the active one highlighted, so it stays the way to hop between them. An env chip names the environment most of the window's traces report.
Two kinds of marker sit on the plots. A deploy is an agent version saved inside the window (v4 · SupportAgent, or instructions v4 · SupportAgent when that version changed the instructions — the deploy a latency or error shift most often traces back to); at most the three most recent are drawn, because more than that is a picket fence. An incident is the bucket with the most errors when it is a real spike — at least five errors and at least twice the window's error rate — labelled by its dominant error class and the agent that errored most in it.
Empty windows say so (No traffic yet — run an agent, or point your app's ActiveAgent telemetry at this workspace) rather than drawing five flat lines.
The metrics API
GET /api/metrics is what the page reads, and what to point your own alerting or reporting at:
| Param | Meaning |
|---|---|
range | 1h, 24h (default) or 7d — the window and its bucket size |
hours | A custom window instead, bucketed to about 96 points (range then reads custom) |
agent | An agent_class; every key in the response is scoped to it |
sort | Ranks the per-agent table: popular, longest, cost, tokens, errors |
The response carries range, bucket_seconds, window_minutes, agent and environment, then totals (requests, requests per minute, p50 / p95 / p99 in ms, errors, error rate, tokens in / out / total, cost, cost per request, tool calls, tool errors, tool error rate), deltas against the previous period (requests_pct, p50_pct, error_rate_pt, tokens_pct, cost_pct; null when there is nothing to compare against), series (one entry per bucket, oldest first, zero-filled, each with ts, requests, requests_by_agent, the three percentiles, errors, errors_by_type, tokens_in, tokens_out, cost, tool_calls, tool_errors), the agents, models, actions and tools rails, errors_by_type and markers. The earlier keys — summary, hourly_requests, by_agent, window_hours, sorts, sort — are still there and still mean what they did, so anything already reading them keeps working.
Percentiles are nearest-rank over each trace's total duration and are computed in Ruby from one pass over the window, so PostgreSQL and SQLite return the same numbers; cost is ModelPricing's estimate per trace from the model on its first LLM span. ActionAgent::MetricsReport is the whole of it if you would rather call it directly.
Scenario evaluations
An evaluation scores an agent one of two ways. Without scenarios it samples the agent's recent recorded generations and scores them against rule, telemetry and LLM-judge criteria. With scenarios it replays a list of user messages you paste in — one fresh run per scenario, per candidate model — and reports which tasks the agent completes, what the failures have in common, and what to change. That is how to answer "can this agent do these new tasks with the tools it has?" and "how does a frontier model compare with the latest open-weights model on my workload?" without waiting for traffic.
Paste scenarios into the Scenarios field of the New Evaluation form, or through the API (scenarios_text, or a scenarios array). One message per line; # Heading lines group related tasks so a group can be run on its own; options after | set expectations:
# Find records
Which gynecologists in Charlotte have scheduling enabled? | tools: find_records
Show me all providers with no license on file
# Blame
Who changed the biography for Dr. AbdelRazek? | contains: AbdelRazek| Option | Meaning |
|---|---|
tools: a, b | A passing answer calls at least one of these tools |
contains: x, y | The answer must contain each pattern (substring or regex) |
not_contains: x | The answer must not contain the pattern |
key: k | A stable key, so results line up across re-imports |
group: g | Overrides the heading for this line |
Compare models takes the candidates as a comma-separated list. A bare name infers its provider from the family (claude-* → Anthropic, gpt-* → OpenAI, name:tag → Ollama); prefix it to be explicit (ollama/qwen3:8b, openrouter/meta-llama/llama-3.3-70b-instruct). Each candidate needs credentials the same way an agent run does — the owner's provider key or the host app's config/active_agent.yml.
A run is queued (EvaluationRunJob) and its results land as each replay finishes. Each replay runs as the evaluation's owner when agents are owned per user, so a tool scoped to its caller sees that user's rows; a multi-tenant install replays unattributed unless a host adapter (ActionAgent.scenario_evaluation_adapter_resolver) runs the suite itself. The suite card opens onto the three questions asked of a run, in that order — is it getting better, which model, what do I fix — and then the evidence behind them.
Runs lists the suite's history, newest first, numbered #n from the oldest so a number keeps naming the same run once the list is capped. A row carries when the run finished, a pass bar per model, and its delta against the previous complete run — +3 passed vs #7, green when it moved up, red when it moved down. A run over a different number of scenarios or models reads partial run instead: those two totals are not comparable and a delta would lie about it. Selecting an older run re-derives everything below — models, what to fix, the matrix, the drill-downs — so the whole card describes the run you are reading, while the collapsed header keeps reporting the latest.
Models gives each candidate its pass bar and k/n, mean score, mean latency, input and output tokens, estimated cost, and the faults it hit as badges (or [+] no faults). The model that did best carries an info-toned judge's pick badge — never a green winner, because losing a comparison by one scenario is not a failing grade — and the verdict line under the panel is the rationale for the pick. The panel says who made it: the judge model, or rules when the run was scored without one and the ranking is pass rate alone.
What to fix turns the faults into work. One card per fault, plus one per instruction change the judge proposed, each naming the scope it speaks for (3 scenarios · both models), the fix it calls for, and the tools involved — deduplicated to one chip per tool, whatever the number of scenarios that hit it: the missing tools a scenario expected, the tools that errored, or the tools the judge suggested adding. When every missing tool resolves to the same MCP server the card names it (served by Playwright) and says whether this agent has it enabled or merely has it available, which is usually the whole diagnosis. The action follows from that: Enable server for Agent deep-links to MCP Services, failing or suggested tools to Tools, an instruction change to the agent's instructions — in-app, with the run still open behind it.
Scenarios is the matrix: one row per scenario, one column per model, filtered by group chips or [ ] failed only. Each row shows the tools the scenario expects as chips, and each cell the [+]/[!] glyph, the score, the fault, and the tools that model actually called — coloured against the expectation, so a call that satisfies it reads green, one that errored red with ✗, and anything else stays muted (no tools called when there were none). Group rows carry k/n passed per model. Opening a row drills into it: each model's answer, its tool calls, its timing, tokens and cost, and the diagnosis behind its fault, with re-run scenario -> to replay that one on its own and a [x] enabled toggle to keep it out of later runs.
The footer states the run's terms — the judge, the criteria it scored on, what it cost — and links to run report ->: the same self-contained page Report#to_html writes for a CLI run, framed in the dashboard's own theme so it does not flash white inside a dark console. Open standalone opens the unframed page, which is the copy to archive next to a CI run. Delete suite, on the right, takes the suite and its runs with it.
A scenario passes when the run completed, met its expectations, and scored at least 0.7 across the evaluation's criteria. Anything else carries exactly one fault, assigned from the evidence in this order:
| Fault | Meaning | Typical fix |
|---|---|---|
run_error | The replay raised, or the model returned nothing | Credentials, model name, throttling |
tool_error | A tool the agent called returned an error | Fix the tool, or its parameter descriptions |
missing_capability | The agent said no tool covers the task | Add the tool the recommendation names |
expected_tool_not_called | The scenario expects a tool the agent did not call | Enable the tool, or sharpen its description / the instructions |
ungrounded_answer | The agent had tools, called none, and still stated specifics — a count, an id, a date — nothing supplied | Instruct it to answer only from tool results; add the tool that returns this data |
forbidden_content / missing_content | A content expectation failed | Instructions, or the tool's output |
low_quality | Criteria scored the answer below 0.7 | Read the answer against the weakest criterion |
missing_capability, expected_tool_not_called and ungrounded_answer are the faults that turn a pasted list of new tasks into a backlog: they say which tasks the current toolset cannot reach and what to build. The last two also tell an honest gap from an invented answer: expected_tool_not_called carries ungrounded: true in its evidence when the answer stated specifics no tool supplied, and ungrounded_answer is the same finding for a scenario that names no expected tool.
The parsing, scoring, diagnosis and report are the framework's ActiveAgent::Evals; the engine adds the persistence, the job, the API and the UI. An app can run the same evaluations against its own agent from Ruby with that module alone.
The API: POST /api/evaluations with scenarios_text; POST /api/evaluations/:id/run with group, keys[], scenario_ids[] and models[]; GET /api/evaluations/:id/runs/:run_id for the results, which carry the same fix_items the What-to-fix cards are built from, server resolution included; GET/PUT /api/evaluations/:id/scenarios to read or replace the suite; and GET /api/evaluations/:id/runs/:run_id/report for the HTML report, with ?theme=dark or ?theme=light to pin its palette.
The MCP facade
The dashboard is itself an MCP server: POST <mount>/mcp speaks Streamable HTTP JSON-RPC, authenticated with a dashboard API key (Settings → API Keys) as a Bearer token. Connect a client with:
{ "type": "http", "url": "https://example.com/activeagents/mcp",
  "headers": { "Authorization": "Bearer aa_..." } }
tools/list offers two kinds of tool:
| Tool | What a call does |
|---|---|
run_<slug> (one per agent the key can reach) | Runs that agent with { message } and returns its answer; a named action marked expose as tool is run_<slug>__<action> |
find_<records>, count_<records>, get_<record> (one set per discovered schema tools class) | Reads the host's records directly, with the tool's own parameter schema, so a client that only needs the rows does not have to ask an agent for them |
Every call runs as the key's caller — the key's owner, or whatever ActionAgent.agent_actor_resolver returns for the request — so a schema tool's scope sees the same actor it would inside an agent run, and an agent's own authorization callbacks decide against the same person. A boundary violation (an undeclared filter, an id the caller cannot see) comes back as a tool result with isError, the shape an agent's model would get; a refusal raised by the host's scope or by an agent answers as a JSON-RPC error (-32003), never as an empty, confident result. Direct reads run no generation, so neither execution_enabled nor the execution quota applies to them. Set ActionAgent.mcp_schema_tools = false to keep schema tools reachable only through agents. agent://<slug> resources return each agent's live scorecard.
Authentication
The dashboard has no authentication by default. Anyone who can reach the route can read your traces. Before deploying anywhere non-local, set an authentication method in the initializer:
ActionAgent.configure do |config|
  # Any proc that authenticates the request — Devise, Rails 8 sessions, basic auth…
  config.authentication_method = ->(controller) do
    controller.authenticate_admin!
  end
end
Or constrain the mount in config/routes.rb:
authenticate :user, ->(u) { u.admin? } do
  mount ActionAgent::Engine => "/activeagents"
end
The local ingest endpoint accepts unauthenticated posts by default (it receives traces from your own app process on your own machine). If the mount is reachable from other machines, set config.ingest_api_key to require a Bearer token — see Self-Hosted Observability. In multi-tenant mode ingest always authenticates per-account keys (see below).
Sending traces to a remote endpoint instead
Point telemetry at any compatible receiver — including the hosted platform — instead of (or in addition to) local storage:
telemetry:
  enabled: true
  endpoint: https://api.activeagents.ai/v1/traces
  api_key: <%= ENV["ACTIVEAGENTS_API_KEY"] %>
The wire format is documented in telemetry.md under "self-hosting endpoint requirements" — anything that speaks it can feed or receive these traces.
Multi-tenant mode (running your own platform)
The engine also supports account-scoped deployments — this is exactly how the hosted platform runs it:
ActionAgent.configure do |config|
  config.multi_tenant = true
  config.account_class = "Account"        # must have a telemetry_api_key column
  config.trace_model_class = "TelemetryTrace" # optional model override
end
In multi-tenant mode the ingest API authenticates with Authorization: Bearer <account.telemetry_api_key> and processes traces asynchronously through ActionAgent::ProcessTelemetryTracesJob (idempotent per trace_id, capped at 100 traces per request). Add an increment_telemetry_usage! method to your account model to hook usage tracking or rate limiting.
Relationship to the hosted platform
| This engine | activeagents.ai (production) | |
|---|---|---|
| Intended use | Development, or your own production mount | Managed production |
| Traces + span waterfall | ✓ | ✓ |
| Metrics + per-agent stats | ✓ | ✓ |
| Trace ingest API | ✓ (single tenant, local) | ✓ (multi-tenant, quotas) |
| Agent builder, runs, versions | ✓ | ✓ |
| Conversations, evaluations, scorecards, cost estimates | ✓ built in | ✓ |
| Accounts, plans, billing, managed sandboxes | Yours to operate | ✓ |
One gem, two contexts: it shows your traces while you develop, and the platform runs the same engine multi-tenant with managed infrastructure. What the platform adds is the business around it — accounts, plans, billing, quotas and cloud sandboxes — not a bigger feature set. To run it as a shared production surface of your own, see Self-Hosted Dashboard.
Conversation persistence
actionagent depends on solid_agent, so it is already in your bundle — the Interactions view is built on the contexts, messages and generations SolidAgent::HasContext records, and dashboard runs persist through it. The concern resolves those by name to solid_agent's own AgentContext, AgentMessage and AgentGeneration models, so run its installer once as well:
rails generate solid_agent:install
rails db:migrate
Include the same concern in your own agents to persist their conversations alongside traces; generation records carry the same trace_id for correlation:
class ApplicationAgent < ActiveAgent::Base
  include SolidAgent::HasContext
  has_context contextual: :user
end
See Persistence (SolidAgent) for the rest of what that gem records — the tool exchange, long-term memory, runs and cost.